

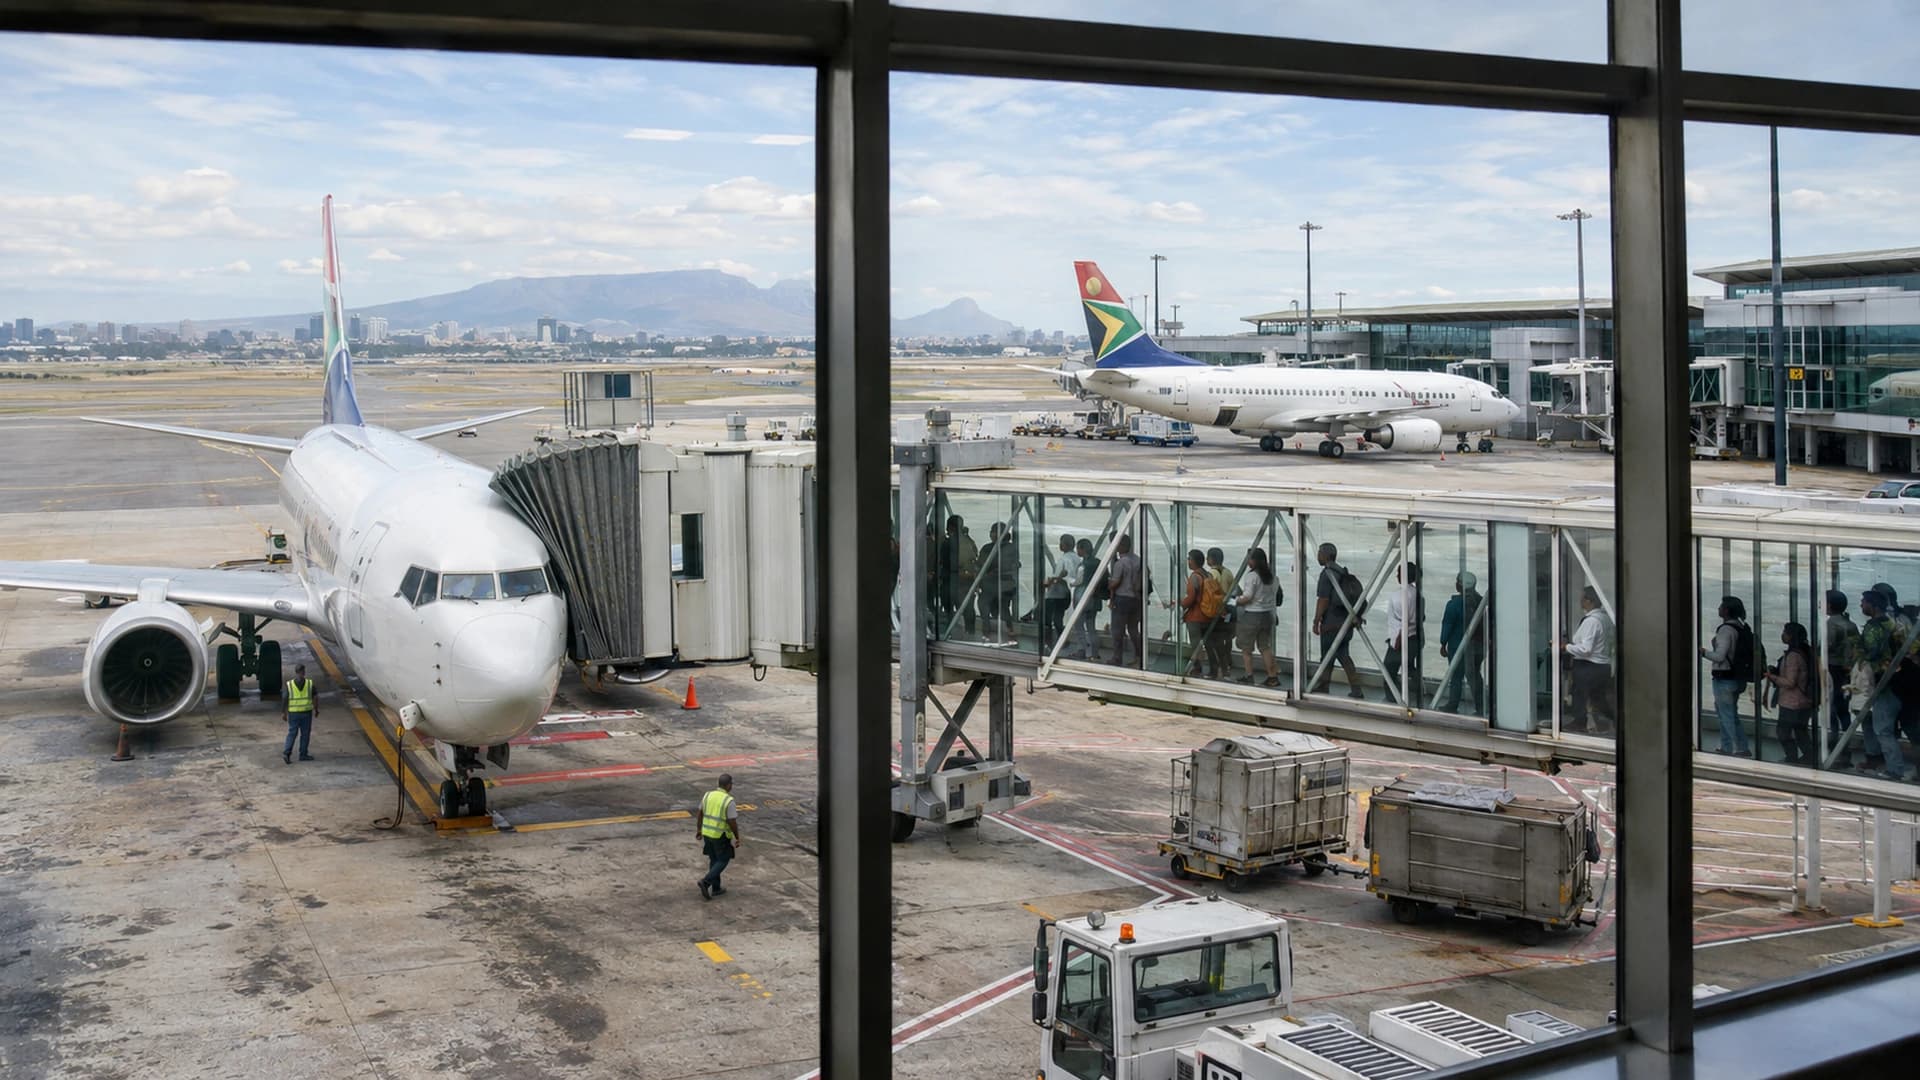
African airline traffic grew in September 2026 as global demand dipped: what travellers should know
Air travel demand did not move in the same direction everywhere in September 2026. The International Air Transport Association (IATA) reported that total global passenger traffic fell by 0.5% compared with September 2025. At the same time, African airlines recorded growth, with their international passenger traffic rising by 8.0% year on year.
Those figures describe a changing industry, not a prediction that a specific flight from Johannesburg, Cape Town or Durban will become cheaper or more expensive. They do, however, help explain why travellers may see different choices across routes and why comparing the details of an itinerary remains useful.
The figures come from IATA's September 2026 passenger-market release, published on 30 October 2026. The association says its data is provisional and may be revised. Its statistics include scheduled traffic reported for member and non-member airlines, with estimates for missing data.
Images are AI-generated illustrations.
What the September figures say
IATA measures passenger demand in revenue passenger kilometres, or RPK. In simple terms, the measure combines paying passengers with the distance they travel. It is not the same as counting individual tickets, airport visits or people. A long flight contributes more passenger kilometres per traveller than a short one.
Across the total global market, demand fell by 0.5% year on year in September. Available capacity, measured in available seat kilometres, fell by 0.2%. The global passenger load factor was 83.2%, down 0.3 percentage points from September 2025.
International traffic, considered separately, rose by 0.4%, while international capacity increased by 0.5%. Global domestic traffic fell by 2.2%. These figures are aggregates across many markets, so they should not be read as a direct measure of demand on a particular South African domestic route.
The difference between international and domestic results is useful context. A worldwide headline can conceal growth in one part of the market and a decline in another. Travellers searching for flights need to look at the particular route, dates and airlines available to them.
African airlines recorded stronger international growth
For international services operated by African airlines, IATA reported an 8.0% increase in demand and an 8.8% increase in capacity compared with September 2025. The international passenger load factor was 74.8%, down 0.6 percentage points year on year.
IATA's total-market table, which combines domestic and international services for airlines in the region, reports different figures: demand rose 5.0%, capacity rose 7.7%, and the load factor was 73.5%. Both sets refer to African airlines, but they have different scopes. They should not be mixed or described as measurements of South African passengers alone.
Capacity growing faster than demand can reduce the proportion of available seat kilometres occupied, even when traffic is rising. That is the broad relationship reflected in the reported load-factor changes. It does not reveal the number of unsold seats on your flight, how an individual airline performed, or how a fare will move next week.
African airlines represent a relatively small share of the global market in IATA's table. A strong percentage increase from that base is significant for the region, but it should be read alongside the absolute size and scope of the market, not as evidence that all African routes experienced the same growth.
The quarterly picture adds route detail
IATA's third-quarter 2026 air transport chartbook reports that African airlines' capacity increased by 8.0% year on year in the quarter, while demand rose by 5.4%. Its regional analysis describes uneven performance across route areas.
For Africa to Asia-Pacific, the chartbook reports demand growth of 12.2% and capacity growth of 13.0% compared with the third quarter of 2025. On Africa to Europe, demand rose 4.9% and capacity rose 6.5%. These are regional route-area measures, not promises about individual services or city pairs.
The chartbook also describes a recovery in Africa to Middle East demand compared with the previous quarter's disruption. It records a year-on-year increase of 0.1% in demand for that route area in the third quarter, following a substantial second-quarter contraction. Airspace restrictions and geopolitical events can affect routeing and schedules, so an aggregate recovery should not be interpreted as a guarantee that a particular connection will operate unchanged.
When reading an industry report, check the measurement period as well as the percentage. A quarterly change compares a three-month period with the corresponding quarter a year earlier. It does not describe what happened on every day in that period or necessarily what will happen in the following month.
What the data can and cannot tell South African travellers
Regional traffic measures are useful for understanding the market, but a traveller's decision happens at a much smaller scale. A person flying from Cape Town to Johannesburg needs to compare the services available on that route and date. Someone connecting to Europe must also consider the international carrier, transfer point and the conditions attached to the whole itinerary.
The IATA figures do not mean every South African airport gained flights, that every African airline expanded, or that a seat will be available at a particular price. Traffic is classified according to the reporting framework in the source, and regional averages can include very different networks and operating conditions.
For local context, Airports Company South Africa publishes airport passenger and aircraft statistics. Airport passenger movements and airline passenger kilometres answer different questions. A connection may involve more than one airport movement, while passenger kilometres incorporate distance. Comparing the two without acknowledging their definitions can produce misleading conclusions.
Use the measures together when appropriate, but do not add them or treat them as interchangeable. Airport figures can help describe activity at a location; airline traffic figures can show how much travel carriers operated across their networks.
Why more capacity does not guarantee lower fares
It is tempting to assume that an increase in capacity automatically produces cheaper tickets. Capacity is one factor in a complex market. The relationship between available seats and fares also depends on demand for particular travel dates, operating costs, competition, booking conditions and the mix of travellers and cabin classes.
A regional increase may come from additional capacity on a route you do not intend to use. Even when a flight has more seats than before, popular dates or flight times can remain expensive. A traveller booking a week before departure may see a different selection from someone searching earlier, and the lowest available fare may have conditions that do not suit either traveller.
Fuel costs and operational disruptions can also influence airline decisions. In its June 2026 industry outlook, IATA discussed higher operating costs, longer routings and disrupted schedules in the context of geopolitical events. That outlook was a forecast and assessment at the time, not a calculation of the price of an individual ticket.
Rather than waiting for a regional statistic to predict a fare, compare the actual flights available for your dates. If your schedule permits, look at nearby dates or alternate airports and then weigh the saving against the time and ground transport involved. Availability and prices can change before payment.
Compare the complete journey
The best-looking fare on a results page is not necessarily the best fit. Check the departure and arrival airports, travel dates and local times. For international travel, note whether the itinerary arrives the following day and how much time you have at any connection.
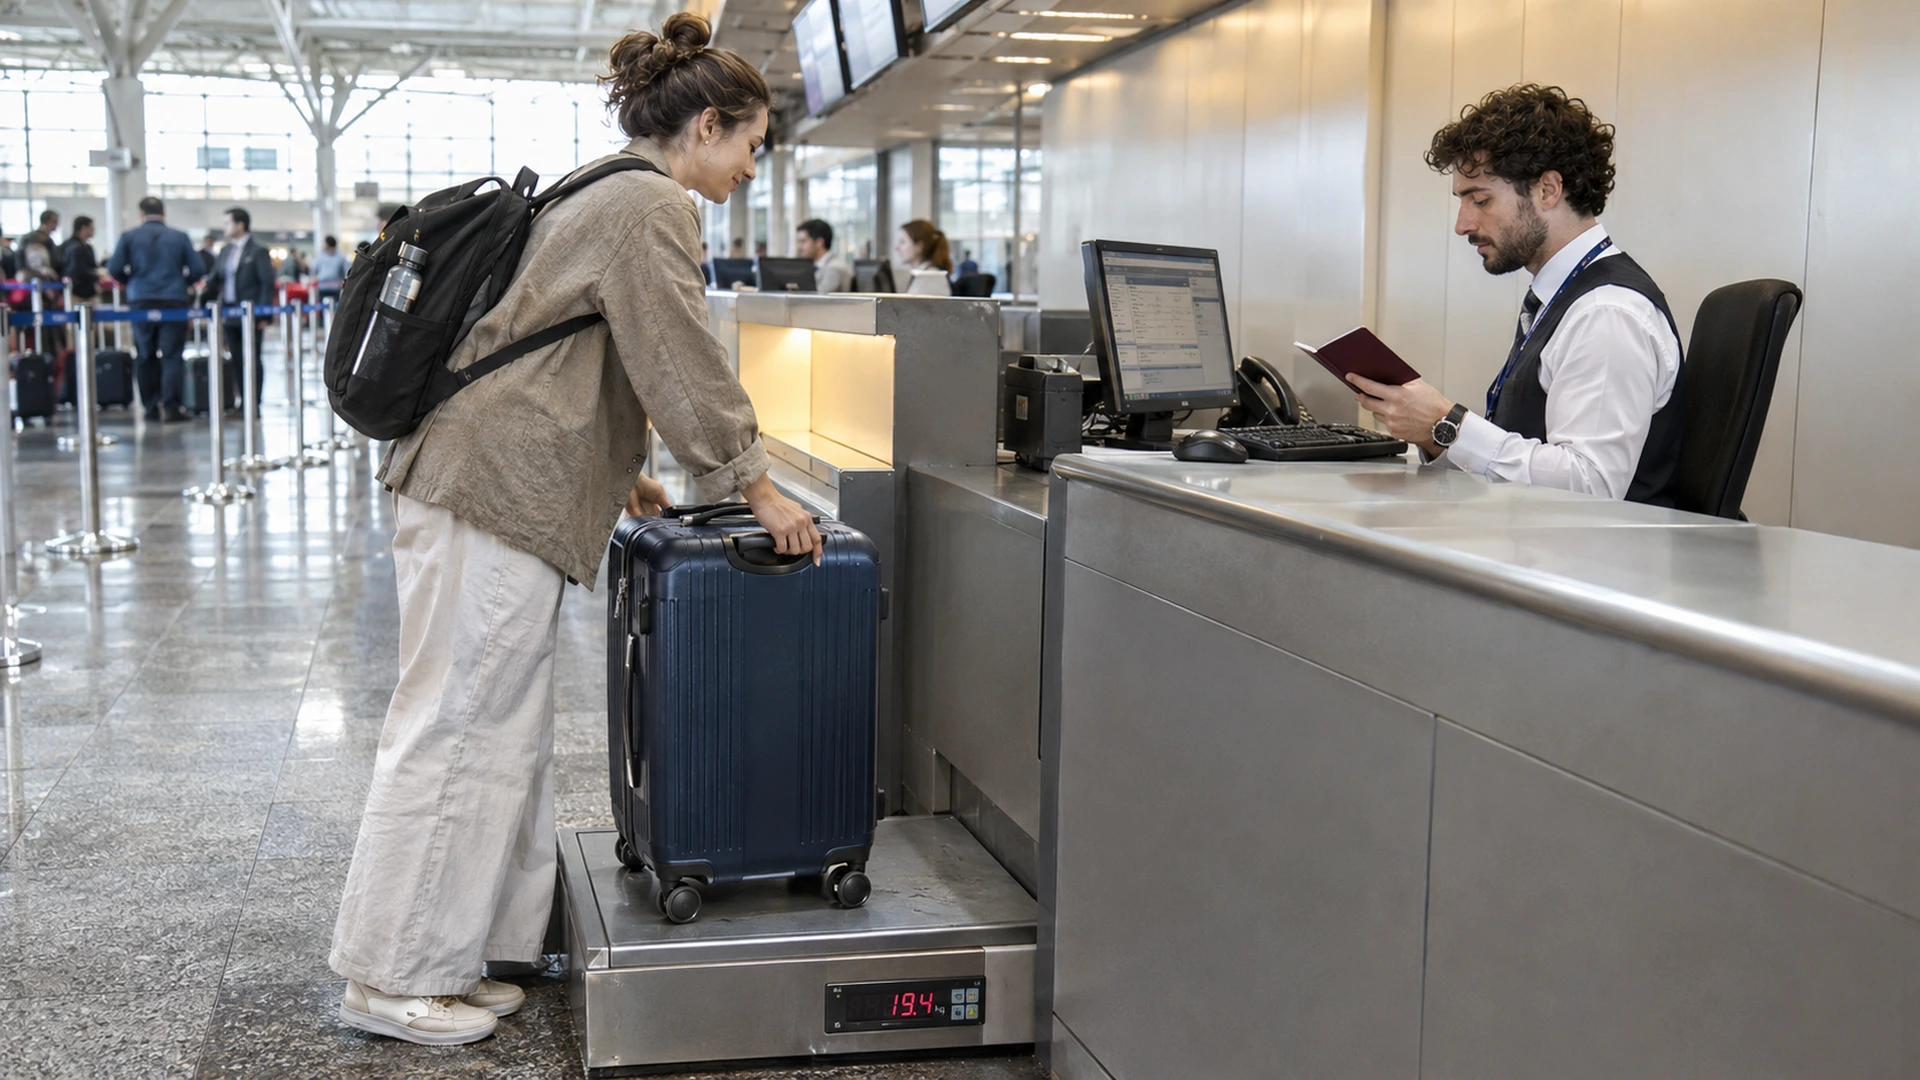
Then check what is included. A ticket with a lower initial price may have a different baggage allowance or change policy from another option. If you need a checked bag, want to sit with family members or expect your meeting dates could change, compare the applicable total and conditions before deciding.
For flights involving more than one airline, identify the operating carrier for each segment and whether the itinerary is ticketed together or requires a self-transfer on separate tickets. If you need to collect and recheck baggage or move between terminals, include that in your assessment of the connection time. The specific rules depend on the carriers, airports and ticket.
A shorter journey may be worth a higher fare for someone attending a time-sensitive event. A longer connection or a different departure time may be a reasonable trade-off for a leisure traveller with more flexibility. The appropriate choice is personal, and neither option is guaranteed to avoid disruption.
When to compare again
A comparison is a snapshot. The number of flights offered, their operating times and the fare conditions can change between searches. If your plans are still being approved, record the itinerary and total price you saw, but confirm the current details before making a commitment. A previously viewed fare is not a reservation.
For a group, compare availability for the full number of passengers rather than multiplying a single advertised fare. Confirm the final passenger-by-passenger total and conditions at checkout. If your trip involves a hotel, meeting or event with its own cancellation terms, consider how those commitments interact with the flight you choose.
Pay attention to schedule changes
Industry data describes traffic that has already happened. Your own journey depends on the schedule and conditions that apply when you fly. Keep your contact details up to date in the booking and watch for messages from the airline or booking provider. Check the airline's official flight information before leaving for the airport.
If a flight changes or is cancelled, the available options depend on the airline, ticket, reason for the disruption and any applicable rules. Contact the airline or booking provider named on your documents and ask what rebooking or refund options apply. If you booked through an agent, clarify whether the request must be handled through that agent.
Do not assume a schedule change on one ticket automatically protects a separately booked onward flight. Ask each relevant provider what is possible before purchasing a replacement. If you have travel insurance, review the policy's conditions and keep the documentation needed for a potential claim.
How to use the figures when planning
Use an industry report as context, then check the information closest to your decision. Start with the airport and destination, the airline's operating schedule and the actual fare conditions. If your travel dates are not fixed, compare several alternatives and note what each one includes.
For a business trip, consider arrival time, meeting commitments, baggage and the cost of a possible change. A lower fare can make sense when plans are firm; greater flexibility may matter more when appointments are likely to move. Ask what fees and fare differences could apply rather than relying on a broad “flexible” label.
For a family holiday, compare the total for every traveller and the baggage you will need. Review transfer time with the whole group in mind, especially if children, older travellers or passengers needing assistance are involved. Check which requests can be made during booking and which need to be arranged with the operating carrier.
The September report suggests that African airlines' international traffic was growing even while the global total softened. The practical lesson is more modest than any promise about fares: conditions differ by market. A careful comparison of the specific itinerary, total cost and ticket rules remains the best foundation for choosing a flight.